- Fountain Hills Ties as Safest Zip Code in Phoenix - Oct 14, 2019
- How Many Single-Family Homes in Maricopa County? - Oct 13, 2019
- Investing in Multi-Family Real Estate in Your 20s - Oct 9, 2019
Here is a brief look at the residential real estate market statistics for Tempe this month. This analysis is for single family homes only. I will cover the Tempe condo market in a future post.
Statistically, the average single family home sold in Tempe, Arizona today is:
- 3.6 bedrooms
- 2.5 baths
- 1,931 square feet
- built in 1980
- listed at $303,381
- sells for $297,867
- receives 98.7% of most recent listing price
- recevies 97.0% of original listing price
- sells at $157/square foot at time of sale
- is on the market for 69 days
In the Arizona Regional MLS (ARMLS) database, there are currently 292 active, 122 under contract (pending) and 26 temporarily off-market listings across all Tempe, Arizona zip codes (85281, 85282, 85283, 85284, 85285 and 85287).
Housing in this area of Phoenix had a slight seller’s market momentum, but it is now teetering almost on balance. Tempe price action is cooling relative to surrounding parts of the Phoenix metro. There is 44% more active inventory in Tempe now than there was 12 months ago. Single family homes are still a little pricier here at $157/square foot compared the the rest of the Valley at $139/square foot (all home types).
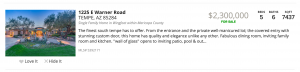
The most expensive MLS listing in Tempe is located in the gated Wingfoot subdivision. The address is 1225 E. Warner Rd. It is listed at $2,300,000 with an impressive catalog of stats. Five bedrooms, 6 baths and 7437 square feet showcase a rare basement, 3 car garage and heated swimming pool.
In the last 10 years, only one home in Tempe has sold over $2,000,000. Fifty-seven single family homes have sold here in the same time period over the $1,000,000 threshold.
Four of the 22 home sites in the Wingfoot community are currently for sale. Two homes in this neighborhood currently hold the top two price spots for Tempe.
Here is the most expensive real estate listing in Tempe as of July 25, 2016.
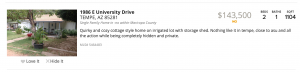
The least expensive single family listing on the market is priced at $143,500. The address is 1986 E. University Drive, just east of the University of Arizona campus. This might be a student rental property and is located in an area of commercial development. It lacks central air conditioning and a municipal sewer connection. The home was built in 1954 and has been on the market for 24 days.
The next graph illustrates the median price action for Tempe. The median price (half above, half below) has notched down in recent days.
Total inventory of single family housing is maintaining a tight range around 300 active homes. This range has held for almost 16 months. With prices up and inventory holding down, this indicates it might be a good time to sell a home.
Average days on market (DOM) metric is down in July 2016 at a level matched in November 2013. This implies a brisk market pace for Tempe right now. On average, new MLS listings will sell in 69 days. In the past few days, this metric has ticked up slightly.
Tempe single family fares slightly better than average across the Valley which is measuring 74 days on market for all housing types.
Median price per square foot for single family homes in Tempe has shown an extremely positive trend (a consistent and nearly uninterrupted push upward) since the trough of the housing crisis. The listing price (not sold price) per square foot average for single family homes is now at $163. It will be interesting to see if this metric holds its ascent through the winter of 2016-17.
The MAI (Market Action Index) below answers the question, “How is the market?”
It illustrates the balance between a buyer’s market and a seller’s market. The 30 mark shows equilibrium, or a balance between the two forces. Above 30 are market conditions that favor sellers. Below 30 are market conditions that favor buyers.
Currently, Tempe registers a score of 41 on the MAI scale, which implies a market advantage slightly in favor of sellers. This would change toward buyers if inventory climbs as snowbirds come back to the Valley this fall to market their homes or the Days on Market (DOM) metric climbs from its current favorable reading.
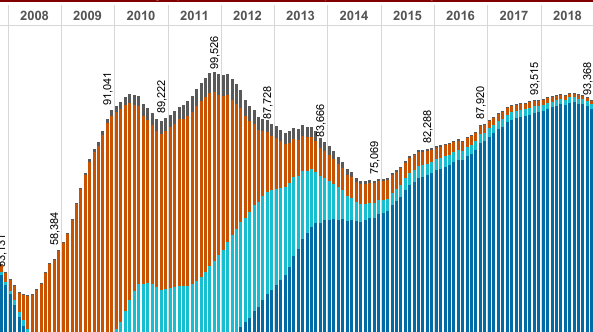
One interesting dynamic is unfolding in Phoenix due to global currency exchange rates. Canadian homeowners, who are 22,000 strong in the Valley, could continue to take advantage of the robust U.S. dollar in order to liquidate their real estate in the metro area. Their purchase activity peaked in 2011 as the Canadian dollar was briefly stronger than the USD in 2011 and again in 2012. This trend in the exchange rate has now reversed.
Find out where Canadians are settling in the Phoenix Valley here.
Most bought during the low point of the market and stand to reap big gains now that the Phoenix housing market and the U.S. dollar have rebounded significantly. I expect many will continue to cash out.
According to Michael Orr’s Cromford Report™, 3 out of 4 Canadian homeowners in metro Phoenix who transacted in residential real estate in 2015 were selling, not buying. This has widened in 2016 where one Canadian is buying here for every 9 who are selling. This continued trend would add additional inventory and tilt the market toward buyers in Tempe.
In addition to the 22,000 Canadian-owned housing units in Phoenix, there are 12,629 homes in our market that are owned by institutional investors. This number was compiled and is tracked by Tom Ruff of The Information Market in Tempe. The figure does not include the smaller “mom and pop” investment flipping operations.
These national large-scale investors in the Valley include Blackstone Group LP, American Homes 4 Rent, Colony Starwood Homes and Invitation Homes according to this article in The Arizona Republic.
Blackstone Group LP is the largest investor in the US to operate single family housing as rentals. They were actively buying up rental inventory in Phoenix in 2011-12 when the market bottomed.
As rents rise along with housing prices, many renters are jumping back in to homeownership since the housing crisis has abated. Many who lost homes years ago through short sale or foreclosure have repaired their credit enough to purchase again. This has left the institutional investors facing a possible market top in their industry along with a 20% attrition rate.
Institutional investors may begin to take their profits and begin selling significant amounts of their inventory, especially if the market falters in the autumn of this contentious presidential election year.
Conclusion
Tempe was one of the hotter spots the Phoenix real estate map, but inventory is climbing in 2016 which will push prices lower if demand remains the same or decreases. Median pricing per square foot has trended up consistently since the bottom of the housing recession but this may trail off with increasing numbers of housing units available.
Conditions are right for selling before inventory will likely seasonally increase later in the calendar year, but buyers may use caution.
It is possible that this trend could extend in the near future with Canadians or institutional investors liquidating many of their properties that they purchased in the trough of the housing crisis. I will be watching pricing and inventory metrics for Tempe this winter as snowbirds return to the Valley to see if the market holds.
Invitation
I am passionate about watching the numbers and understanding the cause/effect in our Phoenix real estate market. If you have a question about selling a home that has been an investment property or personal residence, please consider me as a resource for your real estate needs. I am available at 480-999-6683 or david@arizonareport.com.
David Meek
Broker/Realtor®
The Arizona Report™
In ancient times they had no statistics so they had to fall back on lies.
-Stephen Leacock, Canadian humorist, political scientist and writer